
Following Federal Reserve Chair Jerome Powell’s congressional testimony last Tuesday, gold closed at a 52-week low of $1,225 per ounce—10 percent off its 2018 high of $1,362, set in late January. Powell remarked that he thought the U.S. economy was on course for continued steady growth for the “next several years,” which supports expectations of a rate hike every three months. The comments also sent the dollar up and, consequently, gold down.

In addition to these price moves, we’ve seen suppression and manipulation in the gold market in recent years that have led to the metal being undervalued. This is a topic we discussed in our webcast, “7 Reasons to Invest in Gold Now,” cohosted by Randy Smallwood, CEO of Wheaton Precious Metals.
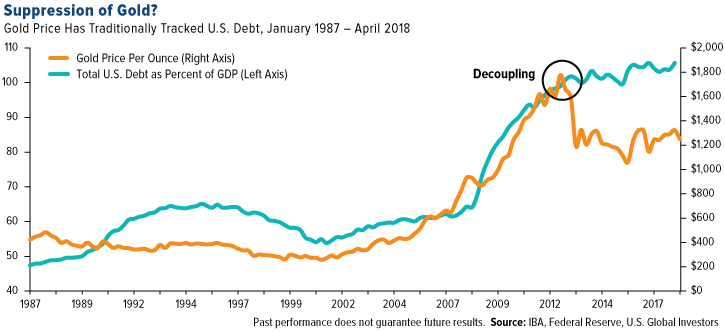
Is the Gold Market Being Suppressed?
What do we mean by “gold suppression”? Historically, the price of gold has tracked U.S. debt, but as you can see in the chart below, that no longer seems to be the case.
The question, we believe, is not whether gold is actively being suppressed, but to what extent and by whom. Traders working at some big banks—including UBS, Deutsche Bank and HSBC—have already been charged for manipulating the price of precious metals futures contracts and fined as much as $30 million by the Commodity Futures Trading Commission (CFTC).
However, we’re skeptical that this has resolved the issue. In the past several years, gold has traded down in the week prior to China’s Golden Week, when markets there are closed—and remember, China is the world’s largest buyer of the yellow metal. As much as $2.25 billion of gold was dumped in the futures market in October 2016, as a trader ostensibly sought to take advantage of the fact that Chinese markets were closed for the week.

During the webcast, Randy Smallwood thoughtfully pointed out that the deliberate suppression of prices can’t go on forever. We agree, and believe that precious metals such as gold and silver are significantly undervalued right now.
So what should investors really be paying attention to?
The Magic Behind the Math
Using an oscillator chart, let’s compare the U.S. dollar to gold. We believe oscillators are vital to identifying the optimal time to buy or sell, and right now it appears that the greenback is overbought while gold is oversold.
Looking back over five years of data, we’ve discovered that, historically, when gold exceeded two standard deviations above the mean, the commodity fell 51 percent of the time in the following three months.
In contrast, when gold prices exceeded two standard deviations below the mean, it rose 77 percent of the time in the following three months. This is because gold is undervalued at this level.

Buying the laggards when the time is right could enable you to participate in a potential rally—and right now, that rally could be in gold, down 2.24 standard deviations as of July 17.
Understanding this kind of math is almost like being adept at counting cards. In the 2008 film 21, an MIT professor helps six students become experts at card counting. The story, based on true events, shows how these students end up taking Vegas casinos for millions in winnings by following their professor’s teachings.
Of course, there’s no way we can promise such an extraordinary outcome in your investments, but we do think there’s something to be said for the magic behind the math.
How to Gain Exposure to the Gold Market
We believe an attractive way to gain exposure to gold in your portfolio is with the U.S. Global GO GOLD and Precious Metal Miners ETF (GOAU). GOAU provides investors access to companies engaged in the production of precious metals either through active (mining or production) or passive (owning royalties or production streams) means. The fund seeks high-quality, well-managed producers that have a proven track record of sustainable profitability—even when precious metal prices are down.
The proof, as they say, is in the pudding. For the one-year period as of June 30, GOAU increased 7.19 percent, beating major gold producers (the NYSE Arca Gold Miners Index was up only 2.52 percent over the same period) and physical gold (up 0.66 percent, based on the LBMA Gold Price).
To learn more, visit the U.S. Global GO GOLD and Precious Metal Miners ETF (GOAU) homepage where you can see its overview, top holdings, performance and more!
Past performance does not guarantee future results.
| Fund | One-Year | Five-Year | Ten-Year | Since Inception | Gross Expense Ratio |
|---|---|---|---|---|---|
| U.S. Global GO GOLD and Precious Metal Miners ETF NAV | 7.19% | n/a | n/a | 6.08% (6/27/2017) | 0.60% |
| U.S. Global GO GOLD and Precious Metal Miners ETF Share Price | 6.88% | n/a | n/a | 6.12% (6/27/2017) | 0.60% |
| NYSE Arca Gold Miners Index | 2.52% | -0.54% | n/a | -6.82% | n/a |
The performance data quoted represents past performance. Past performance does not guarantee future results. The investment return and principal value of an investment will fluctuate so that an investor’s shares, when sold or redeemed, may be worth more or less than their original cost and current performance may be lower or higher than the performance quoted. Short term performance, in particular, is not a good indication of the fund’s future performance, and an investment should not be made based solely on returns. For GOAU performance data current to the most recent month-end please visit www.usglobaletfs.com.
All opinions expressed and data provided are subject to change without notice. Some of these opinions may not be appropriate to every investor.
The U.S. dollar index (USDX) is a measure of the value of the U.S. dollar relative to the value of a basket of currencies of the majority of the U.S.’s most significant trading partners. This index is similar to other trade-weighted indexes, which also use the exchange rates from the same major currencies.
The LBMA Gold Price is the global benchmark prices for unallocated gold delivered in London. The auctions are run at 10:30am and 3:00pm London time. The final auction prices are published to the market as the LBMA Gold Price AM and LBMA Gold Price PM.
The NYSE Arca Gold Miners Index is a modified market capitalization weighted index comprised of publicly traded companies involved primarily in the mining for gold and silver. The index benchmark value was 500.0 at the close of trading on December 20, 2002.
Standard deviation is a measure of the dispersion of a set of data from its mean. The more spread apart the data, the higher the deviation. Standard deviation is also known as historical volatility.